Analysis of the Wave Energy Reduction of Rubble Mound Breakwaters
Side View of Breakwater Model
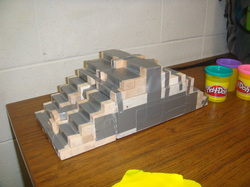
The image on the left is the breakwater model used for all of the testing process. The breakwater was a 1:100 model. The dimensions of the model was 7" wide, by 15.5" in length, and 5.8" tall. The slope gradient in the front of the model was 2:1 and in the back the slope gradient was 1.5:1. These specifications were taken from a consensus of multiple literary papers. The front slope is less steep and has more surface area because that is where the waves will be directly hitting. This way the breakwater has the opportunity to decrease the wave energy that goes onto the other side (coast) of the breakwater. A brick was used as the foundation of the model so that there was enough weight to keep the structure weighted down while in the water. Jenga blocks were used to create the shape of the model and the breakwater slope. As one can see in the image to the left the model was held together by duct tape to secure everything together.
Top View of Breakwater Model
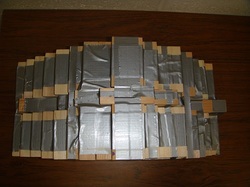
Here is an image of the top of the model. As one can see the blocks were very secure by the extensive use of duct tape.
Finished Product of Breakwater Model
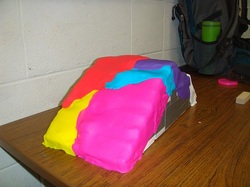
The model was finished off by molding Play-Doh to the surface of the breakwater. We thought thought that this would simulate a cover that one would see on a real breakwater; that would be protecting the rubble or riprap from escaping. Also, it made our project look great!
Testing Conditions
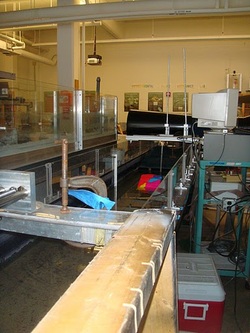
All data was collected in a water flume in the Fluid Mechanics Lab in Engineering Hall. Waves were generated at the very left area of the photo (but is just out of the scope of the photo). The waves were created using a piece of plexiglass and were made in an up-and-down motion which tried to maintain a constant wave period (T). An initial wave height was taken about 6" from the wave generation site and recorded. Two other wave heights were taken before and after the breakwater, to effectively observe the change in wave height once the wave runs into the breakwater. Our original theory was that the wave height would decrease from the 'before' to 'after' wave height reading. The information for water level for each of the models was taken using the Milwaukee Harbor as an area of interest. The modeled water depth (for calculation and modeling purposes) was 30 feet and the storm serge wave height found was 16 feet. This criterion was the basis for the calculation of the emerged and submerged breakwater water level height.
The emerged testing was done with the breakwater model sticking out of the still water level (SWL) by 1.92" out of the water. All information collected can be seen in the Results and Conclusions section.
The submerged testing was completed by placing the breakwater model under the SWL by 0.58". All information collected can be seen in the Results and Conclusions section.
Future Laboratory Adjustments
One way to improve the confidence in our results would be to keep more parameters constant. This would be greatly improved by having access to a wave generator. The wave period (by setting the frequency on the machine) and wave magnitude would keep more parameters constant and would eliminate sources of human error. We would also install the wave height information via an electronic measurement system rather than by eye. This would make us much more confident in our wave height data and would result in more precise calculations of wave energy.
Applying our model to a specific area of interest would also adjust the still water depth as well as the wave generation height. We could model the area and storm serge wave height collecting data from the flume and also making observations of the erosion or sediment transport.
Applying our model to a specific area of interest would also adjust the still water depth as well as the wave generation height. We could model the area and storm serge wave height collecting data from the flume and also making observations of the erosion or sediment transport.
